
Recovery and resilience plan.

In order to understand the plasma-chemical processes it is necessary to investigate physical and physico-chemical properties of the used electrical discharges, with respect to the specific application. Measurements of the electrical parameters of the discharge represent a standard diagnostics method.
Optical diagnostic techniques is widely used for plasma diagnostics as non-invasive and in-situ method. We extensively apply this powerful technique to diagnose all of our cold discharge plasmas. The schematic of the experimental set-up for the optical and electrical diagnostics of DC and AC discharges is shown in Fig. 1. Used electrical and optical diagnostic techniques are described in details in next subsections. Besides the plasma diagnostic, we also perform post-discharge analysis of treated gases and liquids. These techniques are described in sections 2.2 and 3.2.

1.2.1 Optical emission spectroscopy
The light emitted from the discharges is lead through the optical system and focused on the entrance of the optic fibers (Fig. 1). A two-channel emission spectrometer Ocean Optics SD2000 (200-500 nm, spectral resolution 0.6 nm; and 500-1100 nm, resolution 1.2 nm) is used. Alternatively, for much better spectral and temporal resolution necessary to track the nanosecond-short time scale processes occurring in the transient spark pulses, we use a 2-m monochromator Carl Zeiss Jena PGS2 covering UV and VIS (200-800 nm) and providing spectral resolution of 0.05 nm. This is equipped with an intensified CCD camera Andor Istar for nanosecond temporal resolution. The optical system also comprises filters, off-axis parabolic and planar mirrors, irises, pinholes, and fiber optics. The discharge chamber and the optical components are mounted on translation stages, which enable lateral and vertical scanning capabilities.
OES provides valuable information on excited atomic and molecular states. Comparing experimental and simulated emission spectra enables to determine the rotational, vibrational, and electronic excitation temperatures of the plasma and thus the level of nonequilibrium (based on the measured rotational and vibrational temperatures) and the gas temperature (as the rotational temperature that is close to the gas temperature owing to fast collisional relaxation at atmospheric pressure), and sometimes even the electron temperature.
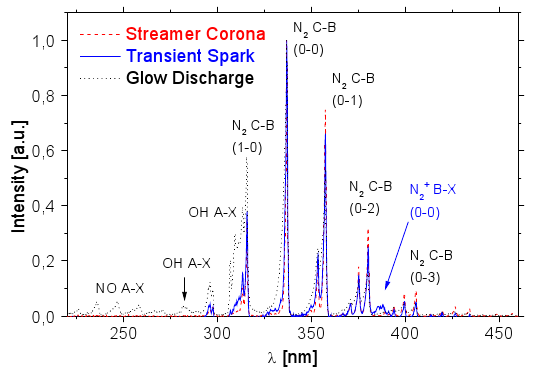
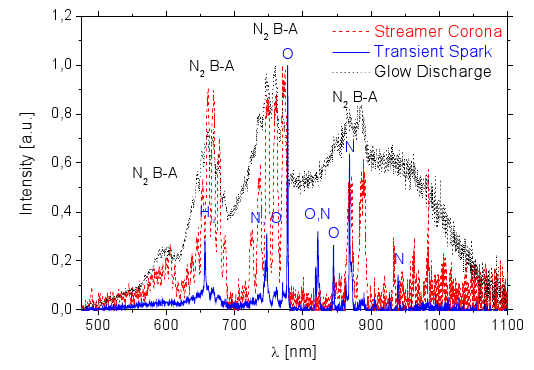
In addition, OES enables us to identify many radicals and active atomic or molecular species and so gives insight in the plasma chemical processes (Figs. 2a and 2b). This enables understanding and optimizing the air or water pollution control processes. Identification of radicals is also of great importance in biological and medical applications in order to understand the mechanisms of bio-inactivation and of the plasma interaction with living cells. Excited states are produced mostly by collisions with energetic electrons, and therefore it is assumed that optical emission can provide a measurement of the plasma active size. This is important in plasma shielding and other applications and also enables calculating basic discharge characteristics and so provides understanding of the physical mechanisms.
Optical emission spectroscopy can also be used for the electron density (ne)
measurement in plasmas.
The most common OES method for the ne measurement is based
on the Stark broadening of atomic emission lines (Fig. 3).
Hydrogen-like lines are the most sensitive
to Stark broadening and they are the most commonly used.
However, the most intense atomic
lines in the atmospheric pressure air plasmas are typically the
lines of atomic oxygen and nitrogen.
Moreover, the difficulty with the Stark broadening is that it depends
not only on ne but also on electron temperature Te.
We measured the electron density evolution during the spark phase of
transient spark (TS)
from the Stark broadening of
Hα line, N line at 746 nm, and O triplet line near 777 nm.
Reasonable agreement between electron densities calculated from the Stark
broadening of these lines was obtained for Te = 10 000 K.

1.2.2 Time resolved imaging
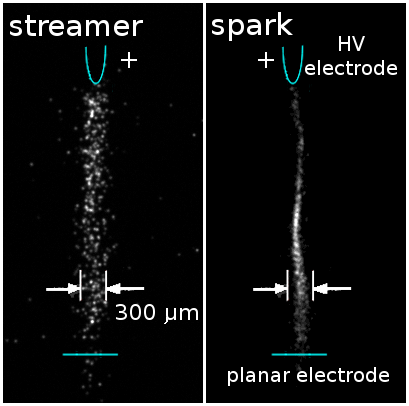
The time-resolved imaging can also contribute to a deeper understanding of the electrical discharges. It can provide information about the various discharge characteristics, such as propagation velocity, branching, or thickness (Fig. 4). Fast changes of plasma properties in streamers or short pulsed discharges such as TS imply high demands on their optical imaging. Time-resolved technique with time resolution in the order of 1 ns (or better) must be used. This can be accomplished by using intensified high speed CCD cameras for the detection of light.
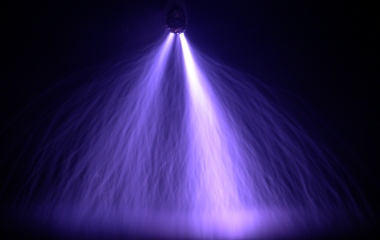
We also used imaging techniques for studying of the electrohydrodynamic spray of water by streamer corona discharge (see section 1.8), for the visualization of the He plasma jet (co-operation with the team of Joanna Pawlat, Lublin University of Technology), and for the research of discharge propagation in capillaries (collaboration with Pierre Tardiveau, University Paris-Sud).
1.2.3 Measurements of electrical discharge parameters
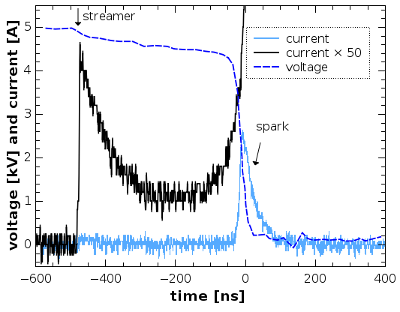
The discharge voltage is usually measured by an HV probe, for example Tektronix P6015A. The discharge current we usually measure on a shunt or by current probe, for example Pearson Electronics 2877 (1V/A). Both voltage and current signals are recorded by a digitizing oscilloscope, for example Tektronix TDS2024 (200 MHz bandwidth, 2GS/s). Fig. 7 shows typical voltage and current waveforms of transient spark discharge.
The oscilloscopic current and voltage measurements and a detailed analysis of the TS electrical circuit parameters enabled us to obtain the temporal evolution of the plasma conductivity in TS discharge. With the knowledge of electron collision frequency and plasma dimensions, we were able to derive the temporal evolution of electron density in the TS discharge from the plasma conductivity. The electron collision frequency was calculated by Monte Carlo simulations of electron dynamics, while the plasma dimensions were obtained by time-resolved imaging using a high-speed iCCD camera (subsection 1.2.2).
The electron density derived from the plasma conductivity was compared with values obtained by optical emission spectroscopy from the Stark broadening of atomic lines (Fig. 5), and used for the validation of chemical kinetic model of the TS discharge.
Further reading:
| Foltin V., Leštinská L., Machala Z.: Spectroscopic investigations of atmospheric pressure microwave torch nitrogen plasma jet, Czech. J. Phys. 56, B712-720 (2006). abstract | download | citations: 5 |
| Machala Z., Janda M., Hensel K., Jedlovský I., Leštinská L., Foltin V., Martišovitš V., Morvová M.: Emission spectroscopy of atmospheric pressure plasmas for bio-medical and environmental applications, J. Molec. Spectrosc. 243 (2), 194-201 (2007). abstract | download | citations: 311 |
| Hensel K., Martišovitš V., Machala Z., Janda M., Leštinský M., Tardiveau P., Mizuno A.: Electrical and optical properties of AC microdischarges in porous ceramics, Plasma Process. Polym. 4 (7-8), 682-693 (2007). abstract | download | citations: 102 |
| Leštinská L., Foltin V., Machala Z.: Emission Spectroscopy of Atmospheric Nitrogen Microwave Plasma, IEEE Trans. Plasma Sci. 36, 962-963 (2008). abstract | download | citations: 7 |
| Janda M., Martišovitš V., Machala Z.: Transient spark: a dc-driven repetitively pulsed discharge and its control by electric circuit parameters, Plasma Sources Sci. Technol. 20, 035015 (10pp) (2011). abstract | download | citations: 60 |
| Janda M., Machala Z.: Imaging of transient spark in atmospheric pressure air by fast iCCD camera, IEEE Trans. Plasma Sci. 39 (11) 2246-2247 (2011). abstract | download | citations: 15 |
| Janda M., Machala Z., Niklová A., Martišovitš V.: The streamer-to-spark transition in a transient spark: a dc-driven nanosecond-pulsed discharge in atmospheric air, Plasma Sources Sci. Technol. 21, 045006 (9pp) (2012). abstract | download | citations: 68 |
| Janda M., Martišovitš V., Dvonč L., Hensel K., Machala Z.: Measurement of the electron density in transient spark discharge, Plasma Sources Sci. Technol. 23 (6), 065016, 12 pp (2014). abstract | download | citations: 43 |
| Pongrác B., Kim H.H., Janda M., Martišovitš V., Machala Z.: Fast imaging of intermittent electrospraying of water with positive corona discharge, J. Phys. D: Appl. Phys. 47, 315202 (2014). abstract | download | citations: 22 |
| Pongrác B., Kim H.H., Negishi N., Machala Z.: Influence of water conductivity on particular electrospray modes with dc corona discharge — optical visualization approach, Eur. Phys. J. D 68, 224 (2014). abstract | download | citations: 10 |
Recovery and resilience plan.
Old website of our division.
In 2022 we organised 9th Central European symposium on Plasma Chemistry and COST Action CA19110 workshop.
In 2016 we organised 6th International Conference on Plasma Medicine, with almost 400 participants.
Do not hesitate to contact us, if needed.